Knowde Enhanced TDS
Identification & Functionality
- Chemical Family
- Chemical Name
- CASE Ingredients Functions
- Technologies
- Product Families
Features & Benefits
- Labeling Claims
Applications & Uses
- Applications
- Coating Type
- Applications
• Graphene research
• Energy conversion
• Energy storage
• Electronics
• Conductive inks and coatings
• Composites
• Catalysis
• Biomedical
• Membranes
• Sensors and biosensors
• Gas separations
• Surfactant
Properties
- Color
- Physical Form
- Appearance
- Brown paste
- Odor
- Odorless
- Typical Properties
| Value | Units | Test Method / Conditions | |
| Solid Content (Concentration,w/w) | 5 - 10 | % | — |
| Solvent | Water | — | — |
| pH | 1.9 - 3.0 | — | — |
| Apparent Density (Tapped) | 0.9 - 1.05 | g/cm³ | — |
| Carbon content (XPS, atomic) | 69.2 | % | — |
| Oxygen Content (XPS, atomic) | 27.6 | % | — |
| Ash (XPS, atomic) | max. 3.2 | % | — |
| Lateral Size of GO Sheets (Precision ±20%, D90) | 2.2 | µm | SEM |
| Lateral Size of GO Sheets (Precision ±20%, D50) | 0.77 | µm | SEM |
| Lateral Size of GO Sheets (Precision ±20%, D10) | 0.29 | µm | SEM |
| Number of Layers (Single atomic layers) | 91.5 | % | Dispersing GO in water followed by sonication |
Technical Details & Test Data
- Technical Analysis
Elemental Analysis
Description Value Unit Carbon (Weight) 40 - 42 % Hydrogen (Weight) 1.5 - 3.1 % Nitrogen (Weight) max. 0.3 % Oxygen (Weight) 44 - 46 % The elemental analysis of Graphene Oxide exhibit a high oxygen content up to 46 wt%. The high oxygen content makes our graphene oxide rich with active functional groups, such as hydroxyl, epoxide, carbonyl, and carboxyl, and promotes high solubility in polar solvents. It also demonstrates great potential for further chemical functionalization.
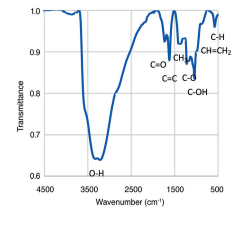
FTIR
FTIR of Graphene Oxide Confirming the existence of various functional groups including –OH, C=O, and C-O-C.
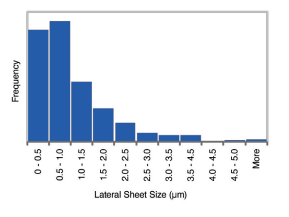
Flake Size Distribution
Size distribution of GO: The GO flake size calculated from an AFM topography image of a GO film using ImageJ software.
XPS Analysis
The XPS scan of Graphene Oxide gives 69.2 at% of carbon and 27.6 at% of oxygen with trace amount of sulfur (1.6 at%) and silicon (1.2 at%). The high-resolution C1s spectrum of Graphene Oxide can be deconvoluted into five peaks corresponding to sp2 carbon (284.5 eV), sp3 carbon (285.4 eV), C-O (287.4 eV), C=O (288.9 eV), and O-C=O (289.9 eV). The relative intensities of the peaks provide an idea about the contribution of each functional group.
C Species Peak BE (eV) Percentage (%) sp2 284.5 3.3 sp3 284.5 30.8 C-O 287.4 57.9 C=O 288.9 5.5 O-C=O 288.9 1.4 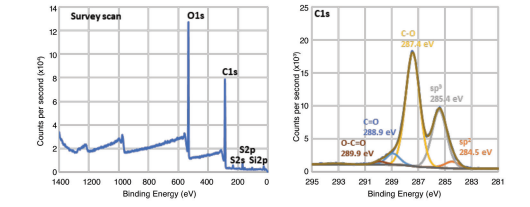
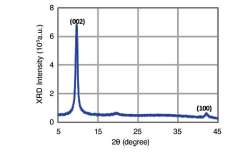
X-ray Powder Diffraction
The XRD peak of Graphene Oxide at 2q = 9.60° corresponds to an interlayer spacing of 0.92 nm due to the introduction of oxygen functional groups. The peak at 2q = 26.4°, which arises from 0.34 nm graphite stacking, is absent, indicating effective exfoliation.
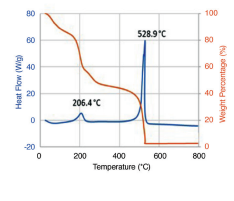
Thermal Analysis
TGA reveals two peaks corresponding to thermal reduction at 206.4 °C and combustion at 528.9 °C.
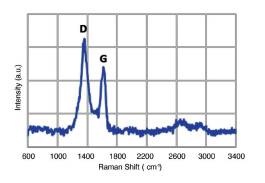
Raman Analysis
Raman spectra shows two intense peaks at 1350 and 1600 cm-1 corresponding to sp3 and sp2 hybridized carbons.
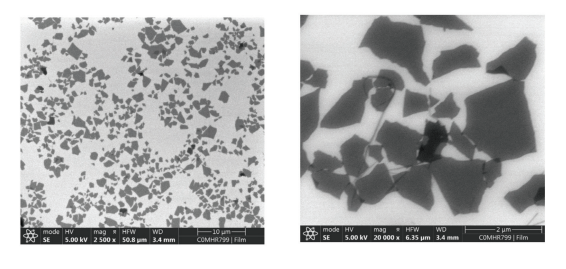
SEM Microscopy
SEM images confirm that Graphene Oxide exists mostly in the monolayer form. Analysis shows that the GO sheets are 98.11% monolayers while the rest is self-folded monolayers and bilayers.
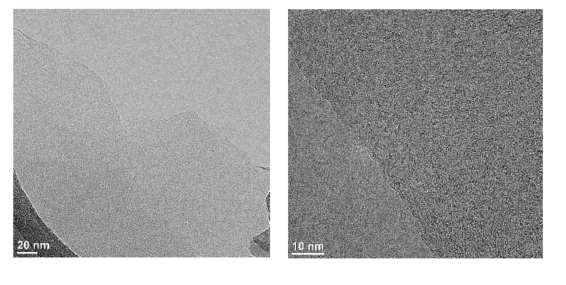
TEM Microscopy
TEM images of the edge of Graphene Oxide nanosheets prove the true monolayer nature of the product.
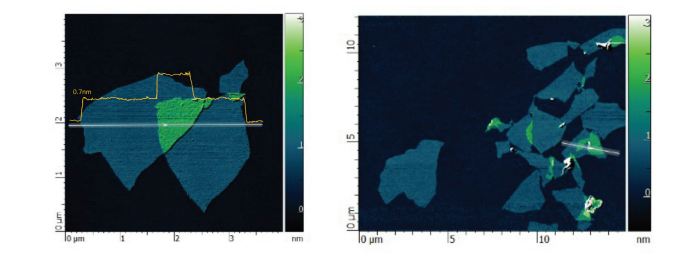
AFM Microscopy
AFM images of the deposited Graphene Oxide nanosheets indicate the successful exfoliation down to the monolayer level. The height of the Graphene Oxide nanosheets is 0.7-1.2 nm thanks to the rich functional groups on their surface.